Introduction
Many liposomal supplements claim superior absorption, but not all products are manufactured to the same standard.
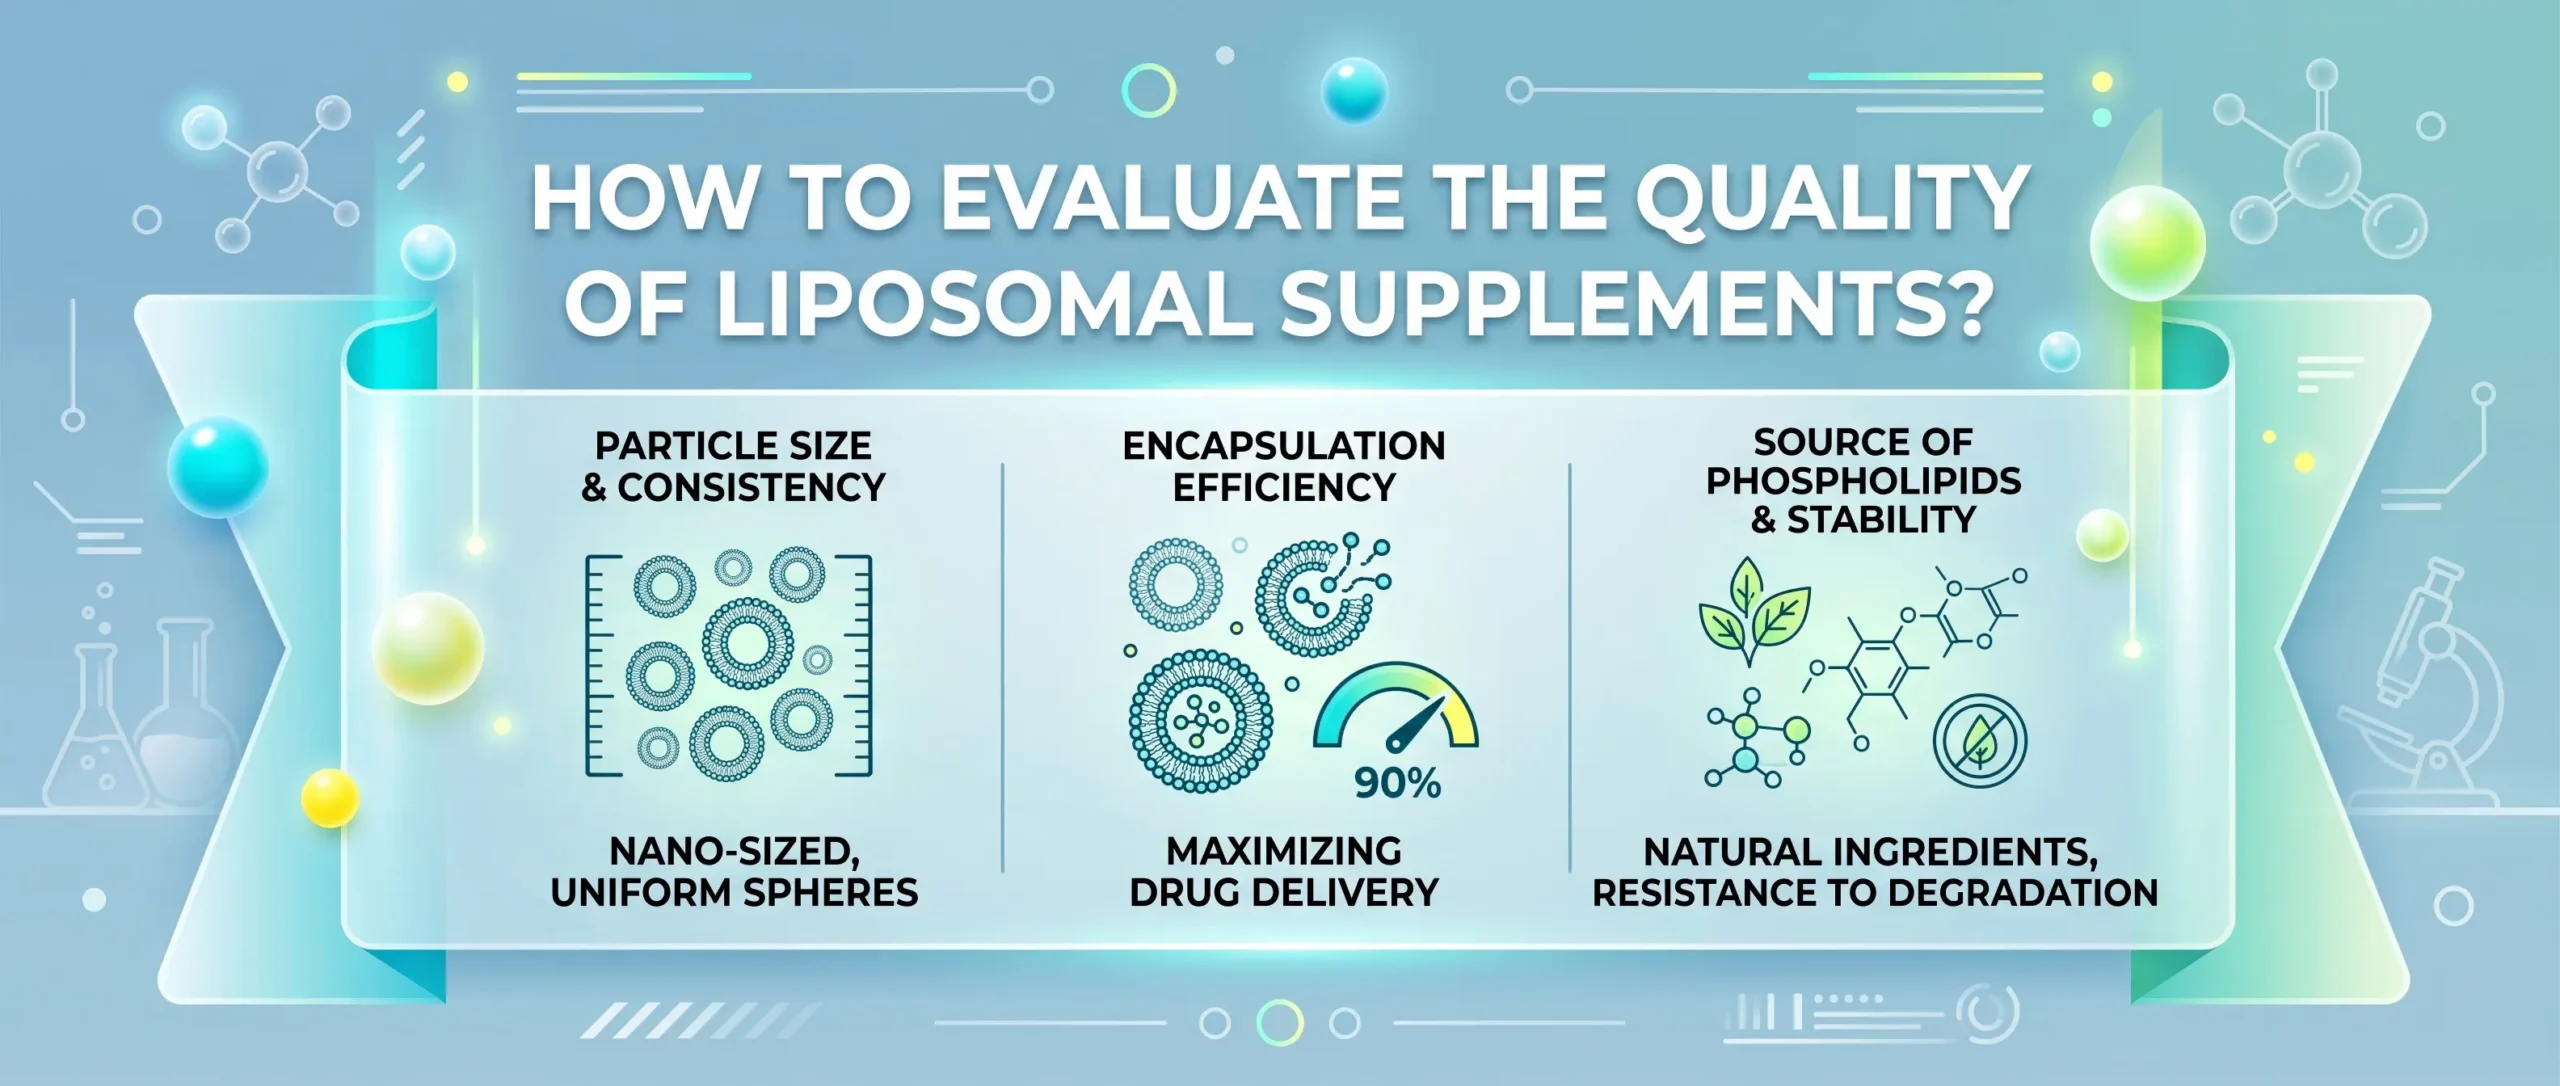
One of the most important indicators of liposome quality is encapsulation efficiency (EE%). It reflects how much of the active ingredient is actually enclosed within the phospholipid vesicles rather than remaining free in the formulation.
For supplement brands and OEM buyers, understanding encapsulation efficiency helps distinguish a well-engineered liposomal product from a formulation that simply contains phospholipids.
Section 1: What Is Encapsulation Efficiency?
Definition
Encapsulation Efficiency (EE%) is the percentage of the total active ingredient that is successfully entrapped within liposomal vesicles, as opposed to remaining unencapsulated (free) in the surrounding medium.
Formula:
Encapsulation Efficiency (%) = Total Active Ingredient/Encapsulated Active Ingredient×100
Or equivalently:
EE% = Total Drug/(Total Drug−Free Drug)×100
What EE% Is NOT
| Parameter | What It Measures | Why It Differs from EE% |
| Assay (Content) | Total amount of active in the product | Does not distinguish encapsulated vs. free |
| Purity | Absence of impurities/contaminants | Quality of the ingredient, not encapsulation |
| Phospholipid Content | Amount of lipid in formulation | Raw material input, not encapsulation outcome |
Key Point: EE% measures the proportion of the active ingredient that is actually protected inside vesicles. A product can have high assay and high phospholipid content but low encapsulation efficiency — meaning most of the active is unprotected and vulnerable to degradation.
Section 2: Why Encapsulation Efficiency Matters
From the OEM Buyer’s Perspective
Higher encapsulation efficiency directly correlates with:
| Benefit | Mechanism |
| Better Protection | Active ingredient shielded from GI degradation, oxidation, and enzymatic breakdown |
| Improved Stability | Encapsulated actives resist hydrolysis and pH changes during shelf life |
| Reduced Degradation | Phospholipid bilayer prevents premature release in stomach acid |
| Higher Delivery Potential | More active reaches systemic circulation intact |
| Lower Ingredient Waste | Less active lost to degradation, improving cost-efficiency |
Clinical Evidence: Liposomal Vitamin C Bioavailability
Multiple randomized controlled trials demonstrate that liposomal encapsulation enhances bioavailability:
Purpura et al. (2024) — A double-blind, placebo-controlled, randomized crossover trial in 27 adults found that 500 mg liposomal vitamin C provided +27% higher Cmax and +21% higher AUC in plasma compared to non-liposomal vitamin C over 24 hours. Leukocyte concentrations were also significantly elevated (+20% Cmax, +8% AUC). European Journal of Nutrition, 63(8), 3037–3046
Zmuda et al. (2024) — In a double-blind crossover trial with 10 adults, liposomal vitamin C powder (1 g dose) showed a 1.3-fold higher AUC and 30% higher C24h compared to non-liposomal form, indicating prolonged blood levels. Applied Sciences, 14(17), 7718
Joseph et al. (2021) — Liposomal calcium ascorbate (400 mg) demonstrated 5.6-fold higher Cmax and 7.2-fold higher AUC versus non-liposomal calcium ascorbate in a double-blind randomized crossover study. RSC Advances, 11, 38161–38171
Scoping Review (Carr, 2025) — A comprehensive review of 10 studies (2016–2024) found that 9 of 10 studies showed higher plasma bioavailability of liposomal vitamin C, with Cmax improvements ranging from 1.2-fold to 5.4-fold and AUC improvements from 1.3-fold to 7.2-fold. Basic & Clinical Pharmacology & Toxicology, 137, e70067
Important Caveat
High EE% does not automatically guarantee higher human absorption. Actual bioavailability depends on multiple factors:
- Particle size and distribution
- Zeta potential (surface charge stability)
- Liposome stability in GI fluids
- Release profile and kinetics
- Clinical evidence for the specific formulation
EE% is a manufacturing quality indicator, not a direct proxy for clinical efficacy.
Section 3: How Encapsulation Efficiency Is Measured
Step 1: Separate Free Drug from Encapsulated Drug
The first critical step is physically separating unencapsulated (free) active from liposome-encapsulated active. Common separation methods include:
| Method | Principle | Advantages | Limitations |
| Ultrafiltration (Centrifugal) | Size-exclusion membranes (e.g., 30–100 kDa MWCO) retain liposomes while free drug passes through | Fast, reproducible, suitable for routine QC | Risk of drug adsorption to membrane; liposome clogging |
| Ultracentrifugation | High-speed centrifugation (e.g., 14,000×g) pellets liposomes; free drug remains in supernatant | Robust for peptides; avoids membrane adsorption issues | Time-consuming; requires careful optimization |
| Dialysis | Semi-permeable membrane allows free drug diffusion while retaining liposomes | Gentle; minimal mechanical stress | Very slow (hours); risk of drug leakage during process |
| Size-Exclusion Chromatography (SEC) | Gel filtration separates by size — liposomes elute first, free drug later | Good separation; widely applicable | Sample dilution; potential liposome disruption |
According to Latorre et al. (2026), ultracentrifugation at 14,000×g for 40 min at 4°C provided the most reliable free peptide recovery (>95%) for phosphatidylserine-liposomes, outperforming centrifugal filters which showed adsorption issues with certain peptides. Analytical and Bioanalytical Chemistry
Step 2: Quantify Drug Concentrations
After separation, both free and total drug concentrations are quantified using validated analytical methods:
| Analytical Technique | Application | Sensitivity | Regulatory Alignment |
| HPLC-UV | Routine QC; UV-absorbing actives (vitamins, many drugs) | LOD ~0.5 mg/L | ICH Q2(R1) compliant |
| UPLC | Faster analysis; higher resolution | Higher than HPLC | ICH Q2(R1) compliant |
| LC-MS/MS | Complex matrices; trace-level quantification | Very high (ng/mL) | Gold standard for specificity |
| UV Spectrophotometry | Simple actives with distinct absorbance | Moderate | Suitable for screening |
Step 3: Liposome Lysis for Total Drug Quantification
To measure total drug, liposomes must be disrupted to release all encapsulated content:
Organic solvents: 50% isopropanol, methanol, or acetonitrile (most common)
Detergents: Triton X-100 (0.1–1%)
Freeze-thaw cycles: Repeated freezing and thawing ruptures bilayers
Critical Requirement: Method Disclosure
Different separation and quantification methods can yield different EE% results for the same product. Therefore, any reported encapsulation efficiency must specify:
Separation method used (ultrafiltration, ultracentrifugation, dialysis, SEC)
Membrane/pore specifications (MWCO, material)
Analytical method (HPLC, UPLC, LC-MS, UV)
Lysis conditions for total drug release
Validation parameters (linearity, accuracy, precision per ICH Q2(R1))
Without this information, EE% values cannot be meaningfully compared between products or laboratories.
Section 4: Encapsulation Efficiency vs. Loading Capacity
Many buyers confuse these two parameters. They measure fundamentally different things:
| Parameter | Encapsulation Efficiency (EE%) | Loading Capacity (LC%) |
| Definition | Percentage of total drug that is encapsulated | Amount of drug loaded per unit weight of lipid |
| Formula | (Encapsulated Drug / Total Drug) × 100 | (Encapsulated Drug / Total Lipid Weight) × 100 |
| Unit | % | mg/g or % |
| Indicates | Manufacturing process efficiency | Formula design optimization |
| Clinical Relevance | Higher EE% = less waste, better protection | Higher LC% = more potent per dose |
| Typical Range | 60–95% for well-formulated products | 1–10% (varies widely by drug type) |
Example:
A liposomal vitamin C with 85% EE and 5% LC means:
85% of the total vitamin C added is inside liposomes
5% of the total formulation mass is vitamin C
The remaining 95% is primarily phospholipids, water, and excipients
Why Both Matter:
EE% tells you if the manufacturing process is efficient
LC% tells you if the formula is economically viable (less lipid needed per mg of active)
Section 5: What Is a Good Encapsulation Efficiency?
No Universal “Good” Number
There is no single EE% threshold that applies to all liposomal products. Acceptable ranges depend on:
Active ingredient properties (polarity, molecular weight, charge)
Phospholipid composition (PC content, saturation, chain length)
Manufacturing method (passive vs. active loading)
Analytical protocol used
Product format (liquid, powder, softgel)
Typical Laboratory-Scale Ranges
Based on published literature across multiple actives and formulations:
| Active Type | Passive Loading EE% | Active Loading EE% |
| Small hydrophilic molecules (e.g., vitamin C) | 30–70% | 80–95% |
| Lipophilic drugs (e.g., curcumin) | 60–90% | 85–98% |
| Peptides/proteins | 2–50% | 40–85% |
| Nucleic acids | 50–90% | 85–99% |
Key Principle: Direct comparisons between products should only be made when the testing methodology is identical. A product tested by dialysis may report a different EE% than the same product tested by ultrafiltration.
Factors That Influence EE%
Ingredient Properties
↓
Lipid Selection (PC content, saturation, cholesterol ratio)
↓
Manufacturing Method (thin-film hydration, microfluidics, ethanol injection)
↓
Homogenization (extrusion, sonication, high-pressure homogenization)
↓
Particle Size (affects surface area-to-volume ratio)
↓
Storage Conditions (temperature, light, oxygen exposure)
↓
Packaging (oxygen barrier, light protection)
Section 6: Factors That Influence Encapsulation Efficiency
1. Ingredient Properties
| Property | Effect on EE% |
| Hydrophilicity | Water-soluble actives partition into aqueous core; EE% depends on aqueous volume |
| Lipophilicity | Fat-soluble actives embed in lipid bilayer; generally higher EE% |
| Molecular Weight | Larger molecules (e.g., proteins) have lower EE% due to size constraints |
| Charge | Oppositely charged actives show higher EE% due to electrostatic attraction |
| pKa | Affects ionization state and partitioning between aqueous and lipid phases |
2. Lipid Composition
Phosphatidylcholine (PC) content: Higher PC purity (>90%) improves vesicle formation consistency
Cholesterol: Increases bilayer rigidity, reducing drug leakage but potentially lowering EE% for some actives
Saturated vs. unsaturated lipids: Saturated lipids (e.g., hydrogenated phospholipids) form more rigid, stable bilayers
PEGylation: Surface PEG coating improves stability but may affect EE% during formulation
3. Manufacturing Method
| Method | EE% Range | Scalability | Best For |
| Thin-film hydration + extrusion | 30–70% | Lab to pilot | General purpose; good control over size |
| Microfluidics | 60–90% | Pilot to commercial | High reproducibility; narrow PDI |
| Ethanol injection | 40–80% | Lab to commercial | Simple; moderate EE% |
| Active loading (pH/ion gradient) | 85–98% | Commercial | High-value actives; maximum EE% |
4. Particle Size
Smaller liposomes (<100 nm) have higher surface area-to-volume ratio
This can increase EE% for bilayer-associated drugs but decrease it for aqueous-core drugs
Optimal size for oral supplements: typically 100–300 nm (balances stability and absorption)
5. Storage and Packaging
Temperature: Refrigeration (2–8°C) slows lipid oxidation and drug leakage
Oxygen: Oxygen-barrier packaging prevents phospholipid oxidation
Light: Amber or opaque containers protect light-sensitive actives
pH: Formulation pH affects drug ionization and bilayer stability
Section 7: Does Higher Encapsulation Efficiency Always Mean Better Absorption?
Answer: No.
While EE% is a critical quality indicator, human absorption depends on additional factors:
| Factor | Why It Matters |
| Particle Size | Liposomes 100–200 nm optimize intestinal uptake; >500 nm may be less efficiently absorbed |
| Zeta Potential | |ZP| ≥ 30 mV ensures colloidal stability and prevents aggregation in GI fluids |
| Liposome Stability | Vesicles must survive stomach acid (pH 1.5–3.5) and bile salts without premature rupture |
| Release Profile | Sustained release vs. burst release affects absorption kinetics |
| GI Environment | Individual variations in gastric emptying, pH, and microbiome |
| Clinical Evidence | Only human pharmacokinetic studies confirm real-world bioavailability |
Key Distinction:
EE% = Manufacturing quality metric
Bioavailability = Human clinical outcome
A product with 95% EE% but poor GI stability may deliver less active than a product with 75% EE% but superior enteric stability. This is why multiple quality parameters must be evaluated together.
Section 8: Can You Judge Encapsulation Efficiency by Looking at the Product?
Common Market Myths vs. Scientific Reality
| Common Claim | Scientific Reality |
| “More oil floating on water means higher EE%” | No. Floating oil phase may come from unemulsified phospholipids, free oils, excipients, or storage-induced phase separation. It does NOT correlate with encapsulation efficiency. |
| “Milky appearance guarantees liposome formation” | No. A milky appearance indicates lipid dispersion but does not verify vesicle formation, size distribution, or EE%. Emulsions and liposomes can look identical macroscopically. |
| “More phospholipids automatically mean higher EE%” | Not necessarily. Excess phospholipids without proper process control can form multilamellar aggregates with poor encapsulation. Formulation design and process parameters are equally critical. |
| “Clear solution means no liposomes” | No. Small unilamellar vesicles (<100 nm) can form optically clear solutions. Clarity does not indicate absence of liposomes. |
Bottom Line: Encapsulation efficiency is a laboratory analytical parameter that requires validated instrumentation and methodology. Visual inspection — whether by water dispersion, microscopy, or appearance — cannot reliably assess EE%.
Section 9: Other Critical Quality Indicators Beyond Encapsulation Efficiency
Professional OEM evaluation requires a comprehensive analytical panel. The FDA’s 2018 guidance on Liposome Drug Products identifies multiple Critical Quality Attributes (CQAs):
| Quality Parameter | Measurement Method | Acceptance Criteria | Why It Matters |
| Particle Size | Dynamic Light Scattering (DLS) | 100–300 nm (oral supplements) | Determines GI uptake efficiency and biodistribution |
| PDI (Polydispersity Index) | DLS | <0.3 (ideally <0.2) | Indicates size uniformity; lower PDI = more consistent product |
| Zeta Potential | Electrophoretic Light Scattering | ≥|30| mV | Predicts colloidal stability; prevents aggregation |
| TEM Images | Transmission Electron Microscopy | Visual confirmation | Verifies actual vesicle structure (unilamellar/multilamellar) |
| Oxidation Stability | TBARS assay, peroxide value | Within specification | Lipid oxidation degrades bilayer integrity |
| Shelf Stability | ICH Q1A(R2) protocols | ≥90% EE retained at expiry | Confirms product viability through shelf life |
| Leakage Rate | EE% monitoring over time | <5% loss per month | Indicates vesicle integrity under storage |
| Active Assay | HPLC/UPLC | 90–110% of label claim | Confirms correct dosing |
| Microbiology | USP <61>, <62> | Absence of pathogens | Safety requirement |
| Residual Solvent | GC-MS | Below ICH Q3C limits | Safety; especially critical for solvent-based methods |
| Heavy Metals | ICP-MS | Below USP <232> limits | Safety compliance |
Regulatory Framework Alignment
Both FDA and EMA require comprehensive characterization of liposomal products:
FDA Guidance (2018): “Liposome Drug Products: Chemistry, Manufacturing, and Controls” mandates characterization of particle size, morphology, net charge, encapsulation efficiency, in vitro release, and leakage rate. FDA.gov
EMA Reflection Paper (2013): “Data Requirements for Intravenous Liposomal Products” requires quantification of free vs. entrapped drug, assessment of aggregation, and in vitro release testing in clinically relevant media.
ICH Q6A: Specifications for new drug products include identity, assay, impurities, and specific tests for liposomal dosage forms.
For B2B buyers: A manufacturer should provide a Certificate of Analysis (CoA) that includes — at minimum — EE%, particle size, PDI, zeta potential, active assay, and microbiological testing.
Section 10: Questions to Ask Your Liposomal OEM Manufacturer
Use this checklist during supplier qualification:
Encapsulation Efficiency & Analytics
How is encapsulation efficiency measured? (Method, separation technique, analytical instrument)
Which analytical method is used for quantification? (HPLC, UPLC, LC-MS — with method validation per ICH Q2(R1)?)
Can you provide method validation reports? (Linearity, accuracy, precision, specificity, LOD/LOQ)
What is the typical EE% range for this specific active?
Can EE% be monitored over shelf life? (Stability-indicating method)
Particle Characterization
What particle size specification do you control? (Target mean, upper/lower limits)
What is the typical PDI? (Should be <0.3)
Do you monitor zeta potential? (Target should be ≥|30| mV)
Do you perform TEM imaging? (To verify vesicle morphology)
Quality & Regulatory
How is batch-to-batch consistency verified? (Statistical process control, Cpk values)
Are stability studies available? (ICH Q1A(R2) real-time and accelerated)
What quality specifications are included in the CoA?
What documentation is available for regulatory submissions? (TDS, MSDS, stability reports, method validations)
Is the facility cGMP-certified? (FDA registered, NSF, ISO 22000, or equivalent)
Do you perform third-party testing? (Independent lab verification)
Process & Scale-Up
What manufacturing method do you use? (Microfluidics, thin-film hydration, etc.)
What is your pilot-scale capability before commercial production?
Can you provide process validation documentation?
What dosage forms can you produce? (Liquid, powder, softgel, capsule, sachet)
What is your typical lead time for custom formulations?
Section 11: Frequently Asked Questions
What is encapsulation efficiency?
Encapsulation efficiency is the percentage of active ingredient that is successfully enclosed within liposomal vesicles, calculated as (Encapsulated Active / Total Active) × 100.
How is encapsulation efficiency calculated?
EE% = [(Total Drug − Free Drug) / Total Drug] × 100. Free drug is separated from liposomes using ultrafiltration, ultracentrifugation, dialysis, or SEC, then quantified by HPLC, UPLC, or LC-MS.
What is a good encapsulation efficiency?
Typical laboratory-scale liposomal formulations report EE% in the range of approximately 60–95%, depending on the active ingredient, phospholipid composition, preparation method, and analytical protocol. Direct comparisons require identical testing methodologies.
Does higher encapsulation efficiency mean better absorption?
Not automatically. While EE% indicates manufacturing quality, actual human absorption also depends on particle size, zeta potential, GI stability, release profile, and clinical evidence. EE% is a necessary but not sufficient condition for bioavailability.
Can encapsulation efficiency decrease during storage?
Yes. Drug leakage from liposomes can occur due to lipid oxidation, hydrolysis, temperature fluctuations, or pH changes. Stability studies per ICH Q1A(R2) should monitor EE% over the product shelf life.
What affects encapsulation efficiency?
Key factors include: active ingredient properties (polarity, MW, charge), lipid composition, manufacturing method, homogenization parameters, particle size, and storage conditions.
How is encapsulation efficiency tested?
Standard workflow: (1) Separate free drug from liposomes via ultrafiltration/ultracentrifugation/dialysis/SEC; (2) Lyse liposomes to release encapsulated drug; (3) Quantify both fractions by validated HPLC/UPLC/LC-MS methods per ICH Q2(R1).
What is the difference between encapsulation efficiency and loading capacity?
EE% measures the percentage of total drug that is encapsulated. Loading capacity measures the amount of drug per unit weight of lipid (mg/g). EE% reflects process efficiency; LC reflects formula design.
Can encapsulation efficiency be measured by appearance?
No. Visual inspection (water dispersion, oil droplets, clarity) cannot reliably assess EE%. EE% requires validated laboratory analytical methods.
Why do different laboratories report different EE% values?
Different separation methods (ultrafiltration vs. dialysis), analytical techniques (HPLC vs. UV), and lysis conditions can yield different results. Method standardization is essential for comparability.
Does every liposomal ingredient achieve the same EE%?
No. EE% varies significantly by active ingredient due to differences in polarity, molecular weight, charge, and compatibility with the lipid bilayer.
Should encapsulation efficiency be included in a CoA?
Yes. EE% is a Critical Quality Attribute (CQA) for liposomal products and should be reported on every batch Certificate of Analysis, along with the test method used.
CTA: Developing Liposomal Supplements with Verified Quality Control
Quality liposomal manufacturing goes beyond mixing phospholipids with active ingredients. It requires:
Liposomal formulation development with optimized drug-to-lipid ratios
Encapsulation process optimization to maximize EE% while maintaining stability
Particle size and PDI control within narrow, reproducible ranges
Encapsulation efficiency testing with validated analytical methods (HPLC/UPLC per ICH Q2)
Stability study support following ICH Q1A(R2) guidelines
Pilot-scale verification before commercial production commitment
Multiple dosage forms: Softgel, capsule, powder, liquid, and sachet manufacturing
OEM / ODM and private label services with full regulatory documentation
Complete technical documentation: COA, Specifications, TDS, MSDS, stability reports, and regulatory support files
[Talk to Our Formulation Team] — Request a Liposomal Manufacturing Consultation and receive a customized technical proposal for your next product.
[View Our Liposomal Supplement OEM/ODM Services] — Explore our full-service manufacturing capabilities from concept to commercialization.
References
FDA. (2018). Guidance for Industry: Liposome Drug Products — Chemistry, Manufacturing, and Controls; Human Pharmacokinetics and Bioavailability; and Labeling Documentation. U.S. Food and Drug Administration. https://www.fda.gov/media/70837/download
EMA. (2013). Reflection Paper on the Data Requirements for Intravenous Liposomal Products Developed with Reference to an Innovator Liposomal Product (EMA/CHMP/806058/2009/Rev. 02). European Medicines Agency.
ICH. (2005). Q2(R1): Validation of Analytical Procedures: Text and Methodology. International Council for Harmonisation.
ICH. (2003). Q1A(R2): Stability Testing of New Drug Substances and Products. International Council for Harmonisation.
Purpura, M., Jäger, R., Godavarthi, A., Bhaskarachar, D., & Tinsley, G. M. (2024). Liposomal delivery enhances absorption of vitamin C into plasma and leukocytes: A double-blind, placebo-controlled, randomized trial. European Journal of Nutrition, 63(8), 3037–3046. https://doi.org/10.1007/s00394-024-03487-8
Carr, A. C. (2025). Do liposomal vitamin C formulations have improved bioavailability? A scoping review identifying future research directions. Basic & Clinical Pharmacology & Toxicology, 137, e70067. https://doi.org/10.1111/bcpt.70067
Zmuda, P., Khaidakov, B., Krasowska, M., et al. (2024). Bioavailability of liposomal vitamin C in powder form: A randomized, double-blind, cross-over trial. Applied Sciences, 14(17), 7718. https://doi.org/10.3390/app14177718
Joseph, A., Kumar, D., Balakrishnan, A., et al. (2021). Surface-engineered liposomal particles of calcium ascorbate with fenugreek galactomannan enhanced the oral bioavailability of ascorbic acid: A randomized, double-blinded, 3-sequence, crossover study. RSC Advances, 11, 38161–38171. https://doi.org/10.1039/d1ra06483e
Latorre, I., et al. (2026). Encapsulation efficiency determination methods for the analysis of different antigenic peptides within phosphatidylserine-liposomes. Analytical and Bioanalytical Chemistry. https://doi.org/10.1007/s00216-026-06453-x
Kapoor, M., et al. (2022). Quality by Design approach in liposomal formulations. Pharmaceutics. (FDA CQA framework reference)